Cardano (ADA) is one of the most discussed long-term cryptocurrency projects in market history. This visual timeline breaks down how a simple $1,000 investment in Cardano evolved over multiple market cycles—highlighting extreme volatility, deep drawdowns, and powerful bull-market rallies that defined ADA’s journey.
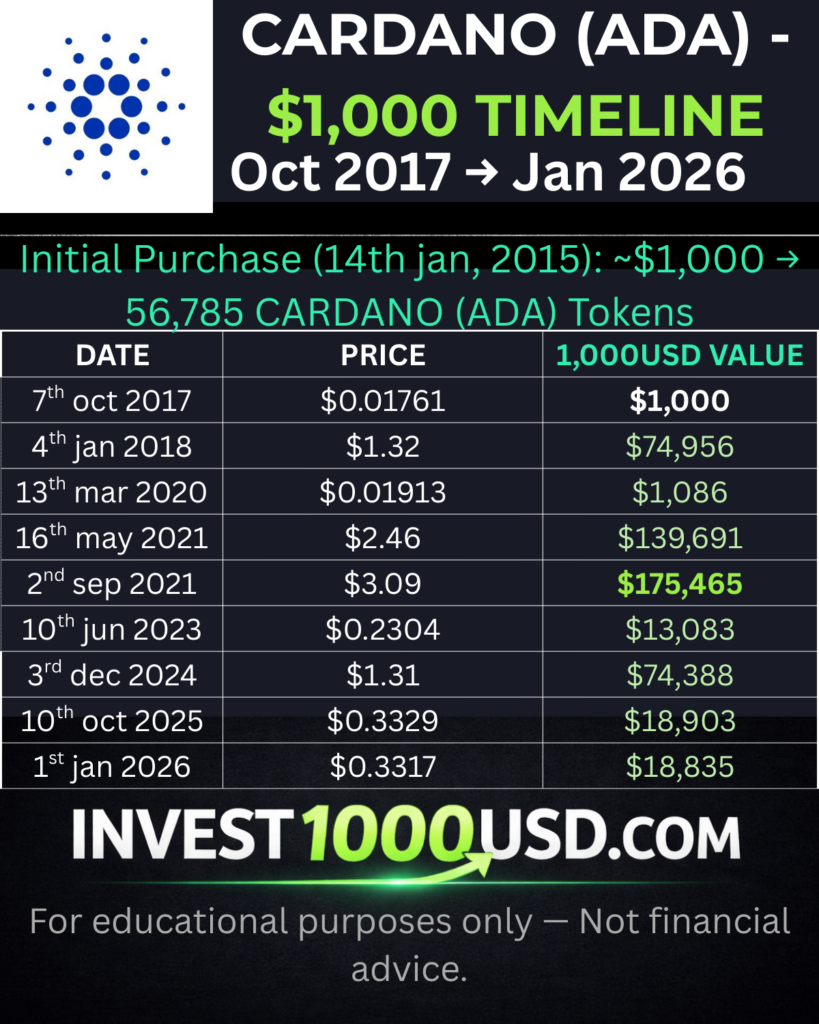
The infographic above tracks Cardano’s price movements from its early days through major market highs and crashes. At its peak in September 2021, the $1,000 investment reached an astonishing value of $175,465. However, the same investment later experienced sharp declines, clearly illustrating how crypto market cycles reward patience but also test emotional discipline.
This Cardano timeline is not about predictions—it’s about understanding market behavior. Long holding periods, fear during crashes, and greed near peaks play a significant role in real-world outcomes. While such returns are rare and never guaranteed, ADA’s history offers valuable lessons for anyone studying long-term, high-risk investments in volatile markets.